
Many manufacturers have the right intentions — quality initiatives, lean training, new software — but still wrestle with inconsistent output, unplanned downtime, and manual bottlenecks that quietly eat into profitability. According to Siemens' 2024 downtime report, unplanned downtime costs the world's 500 biggest companies $1.4 trillion annually, or roughly 11% of their revenue.
That's not a rounding error. That's a structural problem.
This guide breaks down what production and process optimization actually means, the methodologies that have held up on the plant floor for decades, and how automation and robotics are changing what's achievable without adding headcount.
Key Takeaways
- Blend data, people, and equipment to raise output while cutting cost, waste, and downtime
- Lean, Six Sigma, and 5S still anchor the work; AI tools compress the time to results
- Robotic machine tending cells typically pay for themselves within 12-18 months
- Optimization usually stalls from a skilled-engineer shortage, not bad technology
What Is Production and Process Optimization in Manufacturing?
Production optimization is the systematic practice of improving workflows, equipment performance, and resource use to maximize throughput and quality while minimizing waste and cost. People often use process optimization interchangeably, but the two differ in focus.
Production optimization leans toward output and capacity: how many good parts can this line make this shift? Process optimization zooms in on execution: how is each step performed, and where does it lose time or quality? In practice, the two overlap constantly. You rarely fix one without touching the other.
The Production Optimization Formula
There's no single universal formula, but the most widely used framework is Overall Equipment Effectiveness (OEE):
OEE = Availability × Performance × Quality
- Availability: Run Time ÷ Planned Production Time
- Performance: actual run rate vs. ideal cycle time
- Quality: percentage of parts that met spec on the first pass
Here's why this beats raw output numbers. A published shift example calculated 88.81% Availability, 86.11% Performance, and 97.80% Quality. Multiply those together and OEE lands at just 74.79%, not the 90%-plus most managers assume from a "good" shift.
That 25-point gap is hidden capacity. It won't show up on a report that just tracks units shipped, but it's costing real money every shift.

Core Goals of Optimization
Whatever methodology you choose, real optimization targets the same core outcomes:
- Consistent quality: fewer defects, less rework, predictable output
- Shorter lead times: from raw material to shipped part
- Lower per-unit cost: spreading fixed costs over more good parts
- Greater agility: shifting production without a six-week retooling project
Here's the part most plants miss: optimization requires aligning three variables at once: the equipment, the process design, and the people running it. A plant can install the best robot on the market and still underperform if it lacks the engineering talent to program, run, and maintain it.
Proven Strategies and Methodologies for Process Optimization
Decades on the plant floor have narrowed optimization down to a handful of proven methods. Each targets a different type of loss, and most high-performing plants run several at once.
| Method | What It Targets | Key Tool |
|---|---|---|
| Lean | Non-value-added steps | Value stream mapping, JIT |
| Six Sigma / DMAIC | Variability and defects | Define-Measure-Analyze-Improve-Control |
| 5S | Wasted motion and disorder | Sort, Set in Order, Shine, Standardize, Sustain |
| Kaizen | Missed frontline insight | Continuous improvement culture |
| Predictive maintenance | Unplanned equipment failure | Sensor data + analytics |
Lean manufacturing attacks waste directly. Value stream mapping documents every step in a process — material flow and information flow together — to expose where time and effort add no value. Just-In-Time (JIT) production builds on that, making and delivering only what's needed, when it's needed, using pull signals and takt time instead of forecasts.
Six Sigma and DMAIC take a statistical approach, treating variation as the enemy . Teams define the problem, measure baseline performance, analyze root causes with data, improve the process, then lock in controls so the gains stick.
5S is simpler but easy to underestimate. Giving every tool and part a defined place cuts search time and wasted motion across a shift.
Kaizen empowers the people closest to the work to flag inefficiencies. No single kaizen event transforms a plant, but the gains compound over a year of shifts.
Predictive maintenance and IoT monitoring are where recent gains have been largest. Sensor data flags bearing wear, temperature drift, or vibration anomalies before they cause a breakdown.
McKinsey reports predictive maintenance typically reduces machine downtime by 30% to 50% and extends machine life by 20% to 40%. That's a realistic target, not a guarantee, once sensors are deployed and someone's actually watching the data.

How Automation and Robotics Drive Manufacturing Optimization
Robots remove the human bottleneck from tasks that are repetitive, hazardous, or precision-critical. Take machine tending: a robot opens the door, loads the part, closes the door, and restarts the cycle without a break, a lunch, or a shift change.
That keeps the spindle running through hours a manual cell can't cover, pushing more parts through the same capital equipment.
AI-assisted simulation is changing the front end of these projects too. Engineers now model and test robot programs virtually before a single line of code touches the floor. Motion-path conflicts and cycle-time issues get caught in simulation instead of during costly live commissioning. What used to take weeks of on-floor programming is increasingly compressed into days.
That same AI layer is showing up in maintenance. AI-driven health assessments monitor equipment behavior and flag developing issues early enough to turn a weekend breakdown into a scheduled Tuesday-afternoon fix. That same predictive logic now runs plant-wide.
Process-specific gains are just as concrete:
- Robotic painting systems hold film build within specification shift after shift, cutting overspray and material waste from manual spray variability
- Dispensing systems validate bead width, placement, and continuity in real time, catching thin beads or missed spots before the next station
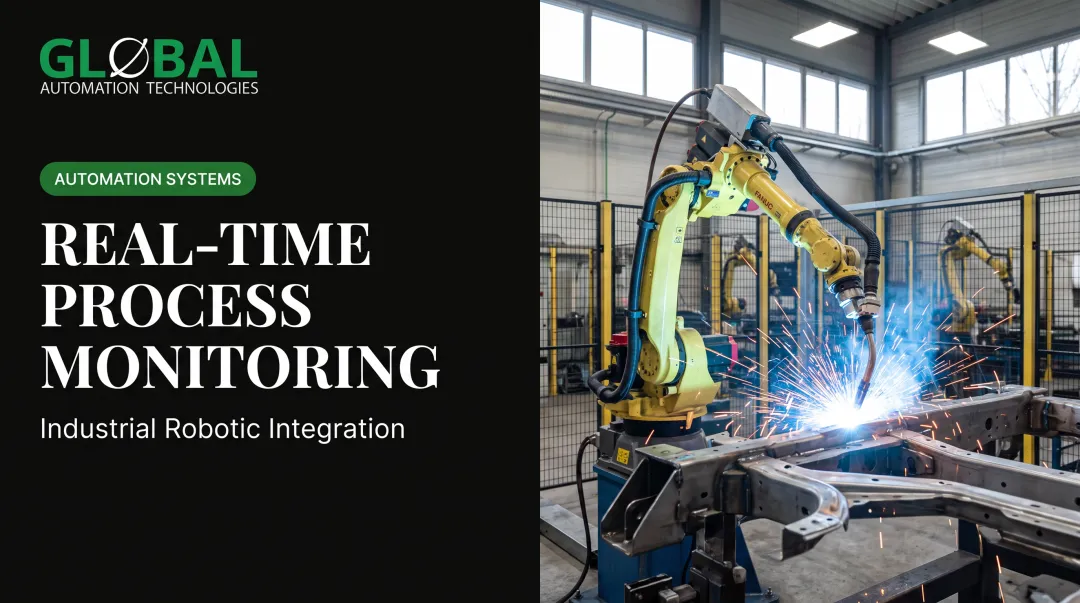
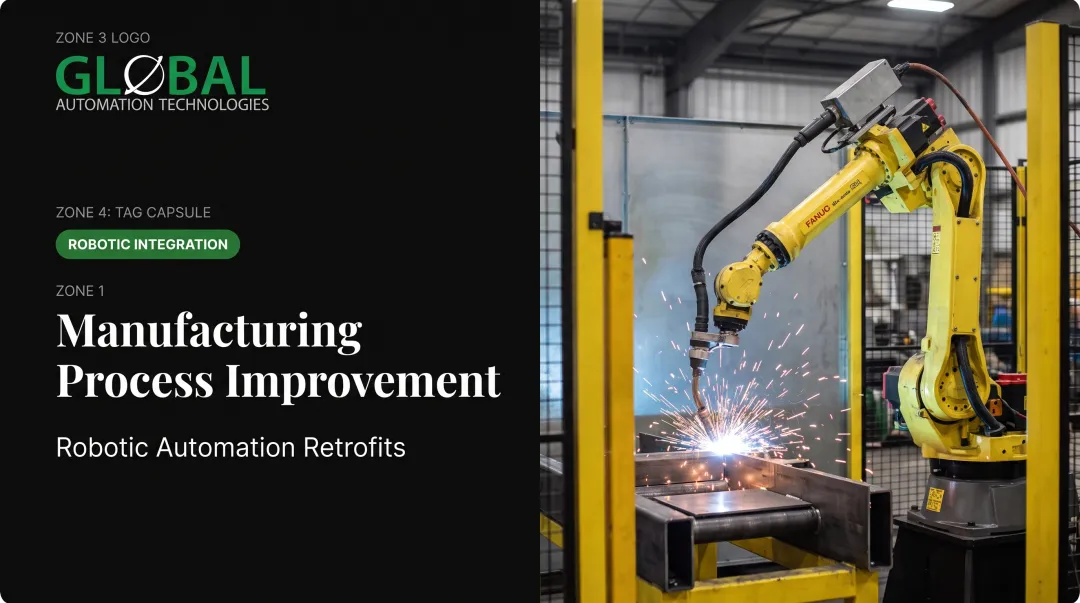
- Welding cells hold consistent torch angle and travel speed that manual processes can't match shift after shift
This is where the two halves of optimization have to meet: the machine and the people running it. GLOBAL Automation Technologies builds both.
As a Level 5 FANUC Authorized System Integrator, GLOBAL designs and commissions robotic cells for machine tending, painting, dispensing, welding, and material handling. Its technical staffing recruits the controls engineers, programmers, and commissioning talent into the customer roles that run them. Machine tending cells built this way typically pay for themselves in 12 to 18 months, driven by more parts per shift with fewer direct labor hours.
Most optimization efforts don't stall because the technology fails. They stall because there aren't enough qualified engineers to program, run, and maintain what's already installed. That's a staffing problem wearing a technology costume, and it's the gap GLOBAL's combined integration-and-staffing model was built to close.
The 7 Types of Manufacturing Processes
Not every plant runs the same way, and an optimization strategy that works in one process type can fall flat in another.
Manufacturing is commonly grouped into seven process types, from high-volume lines to one-off job shops and additive builds.
- Repetitive manufacturing: dedicated lines producing the same item or close family continuously
- Discrete manufacturing: distinct units assembled with frequent setups or changeovers
- Job shop manufacturing: flexible production areas making one-off or low-volume versions
- Continuous process manufacturing: runs nonstop like repetitive production, but with gases, liquids, powders, or slurries
- Batch process manufacturing: finite production runs, with equipment reset between batches
- Additive manufacturing (3D printing): parts built layer by layer from a digital design
- Casting and molding: molten material poured or injected into a mold, common in metal casting and plastics
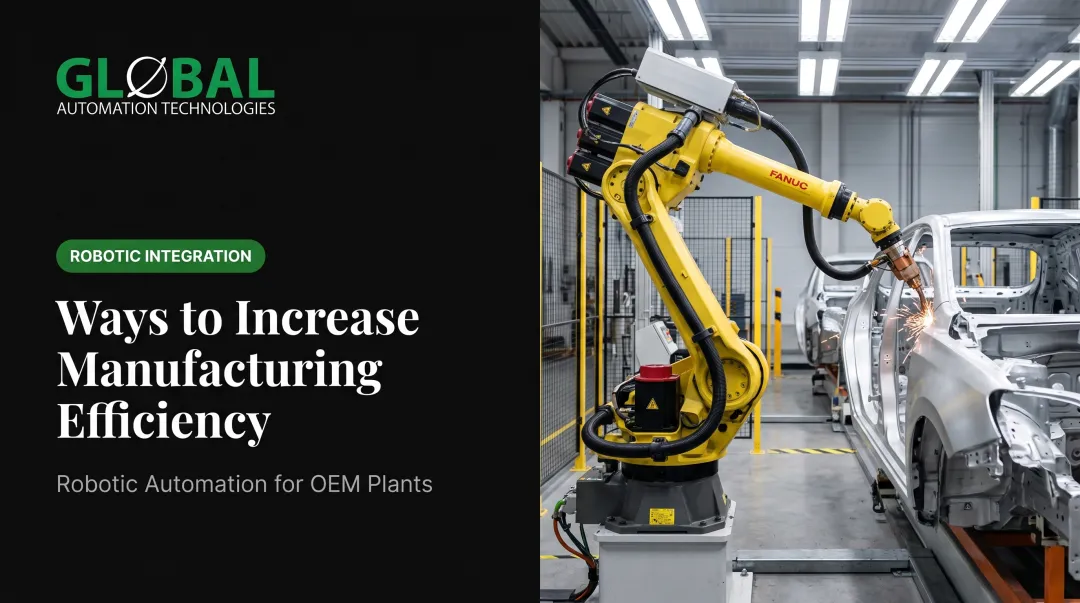
Repetitive and discrete manufacturing, such as automotive body shops and heavy equipment assembly, tend to see the fastest ROI from robotic optimization. High-volume, standardized tasks are what robots do best. Knowing which process type your plant runs is the first real decision point for choosing an optimization strategy.
Common Bottlenecks That Block Optimization Efforts
Poor data visibility hides the very problems optimization is supposed to fix. The Manufacturing Leadership Council reported in 2024 that 70% of manufacturers still collect production data manually: spreadsheets and clipboards standing in for the real-time systems that would actually reveal where bottlenecks live.
The skills gap is easy to overlook and costly to ignore. Advanced automation and predictive tools are only as good as the engineers available to run them. Controls engineers, PLC programmers, and commissioning engineers are consistently among the hardest roles for manufacturers to fill internally, which is one reason staffing has become as critical to optimization as the equipment itself.
Legacy equipment and change resistance round out the list:
- Older machinery wasn't built with sensors or connectivity in mind, and retrofitting it takes planning most plants don't budget for
- Cultural resistance compounds the problem: operators who've run a line one way for years don't always welcome a robot cell, even when the data says they should
- Neither issue gets solved by buying better technology alone
Frequently Asked Questions
What is manufacturing optimization?
Manufacturing optimization is the ongoing process of improving equipment performance, workflows, and resource use to boost output, quality, and cost efficiency. It's never a one-time project.
What is the formula for production optimization?
There's no single universal formula, but OEE (Availability × Performance × Quality) is the most widely used metric-based approach. The right strategy beyond that depends on each plant's specific goals.
What are the 7 types of manufacturing processes?
The seven commonly referenced types are repetitive, discrete, job shop, continuous process, batch process, additive/3D printing, and casting and molding. Each needs a different optimization approach.
What's the difference between production optimization and process optimization?
Production optimization focuses on output and capacity — how much you can make. Process optimization focuses on how individual steps are executed. The two overlap heavily in practice.
How long does it take to see ROI from production optimization investments?
Timelines vary by initiative. Robotic machine tending is a useful benchmark: cells typically pay for themselves in 12 to 18 months through higher spindle utilization and reduced labor hours.
How does robotic automation support production optimization?
Robotics reduces manual bottlenecks, extends production well beyond a single shift with lights-out running between scheduled maintenance windows, and improves part-to-part consistency. Paired with AI-assisted simulation and predictive maintenance, it also cuts startup risk and unplanned downtime.