
Traditional periodic reporting—end-of-shift summaries, daily production logs—creates dangerous blind spots. Problems compound in silence while operators focus on the next part. When issues finally surface, the damage is already done. Automotive manufacturers face downtime costs of $2.3 million per unproductive hour, turning small detection delays into catastrophic losses.
Key Takeaways
- Real-time monitoring captures and analyzes process data within seconds, enabling intervention during production rather than after the fact
- Integrated vision, flow, and sensor systems detect deviations immediately, catching defects after one bad part instead of an entire batch
- Continuous monitoring creates audit trails automatically, meeting aerospace, medical, and automotive traceability requirements without manual documentation
- Brownfield retrofits connect legacy equipment through gateway devices and middleware, bringing older lines into real-time visibility
- Systems typically deliver measurable scrap and downtime improvements within 3–6 months of deployment
What Is Real-Time Process Monitoring?
Real-time process monitoring is the continuous, automated capture and analysis of manufacturing process data as events occur—not hours or days later. The system watches what's happening now and alerts you the moment something goes wrong.
When a temperature climbs too high, a pressure drops too low, or a bead runs off-spec, operators and engineers get the signal in time to act before defects spread or downtime grows.
Real-Time vs. Periodic Reporting
"Real-time" means data captured, analyzed, and displayed within 1–5 seconds. That window lets operators intervene while production is still running. Industrial communication protocols like PROFINET RT support device cycles from 250 microseconds to 512 milliseconds, well inside this threshold.
Periodic reporting works on a slower cycle. Sample-based analyzers can describe material produced 30 minutes earlier, too late to correct the affected batch.
The two serve different purposes:
- Real-time monitoring: live visibility into what is happening now, so teams can respond immediately
- Periodic reporting: a record of what already happened, used for trend analysis and management review

Both matter. Monitoring catches problems during production; reporting reveals patterns over time.
Where It Fits
Real-time monitoring sits between machine control systems (PLCs, robot controllers) and higher-level planning systems (MES, ERP). ISA-95 places field sensing and control at Levels 0–2, manufacturing operations at Level 3, and ERP scheduling at Level 4. Monitoring bridges the gap, pulling live data from the shop floor and feeding summarized insights to enterprise systems.
Key Components of Real-Time Process Monitoring Systems
Data Acquisition Layer
Sensors capture process variables directly from equipment as production runs:
- Temperature, pressure, force, torque, vibration sensors track physical process conditions
- Vision systems inspect parts, verify positions, and measure dimensions
- Machine state monitoring tracks runtime, idle time, fault conditions, and cycle counts from robot controllers and PLCs
At GLOBAL, engineers pair AI-assisted simulation with real-time monitoring. Before deployment, they model and optimize robot programs in simulation—cutting programming time from weeks to days and catching path, timing, and process issues before commissioning.
Once cells are live, vision and flow-monitoring systems validate dispensing bead width, placement, and continuity in real time. AI-driven health assessments flag equipment issues before they cause downtime.
Communication and Integration
Connecting sensors to analytics requires industrial communication protocols:
| Protocol | Role | Cycle Time |
|---|---|---|
| PROFINET RT | Layer-2 real-time exchange for sensors and actuators | 250 μs – 512 ms |
| OPC UA PubSub | Standardized data exchange for real-time channels like TSN | Varies by implementation |
| MQTT 5.0 | Brokered publish/subscribe for edge-to-cloud data flow | No deterministic guarantee |
| EtherNet/IP | TCP/IP and UDP with CIP services for I/O and motion control | Varies by implementation |
Data flow architecture:
- Edge devices collect data from sensors and machines
- Middleware aggregates and normalizes data streams
- Cloud or on-premise systems analyze and display results
Brownfield challenges: Older equipment often lacks native networking, and legacy controls may still run obsolete proprietary software.
Retrofit solutions include intermediate PLCs that convert signals and translate data between retrofit gauges and machine control systems. Gateway devices then bridge legacy equipment to modern monitoring infrastructure.
Analytics and Alerting
Real-time analytics run on live data streams to detect problems as they develop:
- Statistical Process Control (SPC) uses control charts to signal when corrective action is necessary, tracking dimensions, temperatures, or cycle times against upper and lower control limits
- Anomaly detection identifies deviations from normal behavior against historical baselines
- Predictive monitoring uses vibration analysis, wear indicators, and equipment health models to flag issues before failure
When thresholds are breached, automated alerts notify operators via email, SMS, andon systems, or mobile apps.
Visualization and User Interface
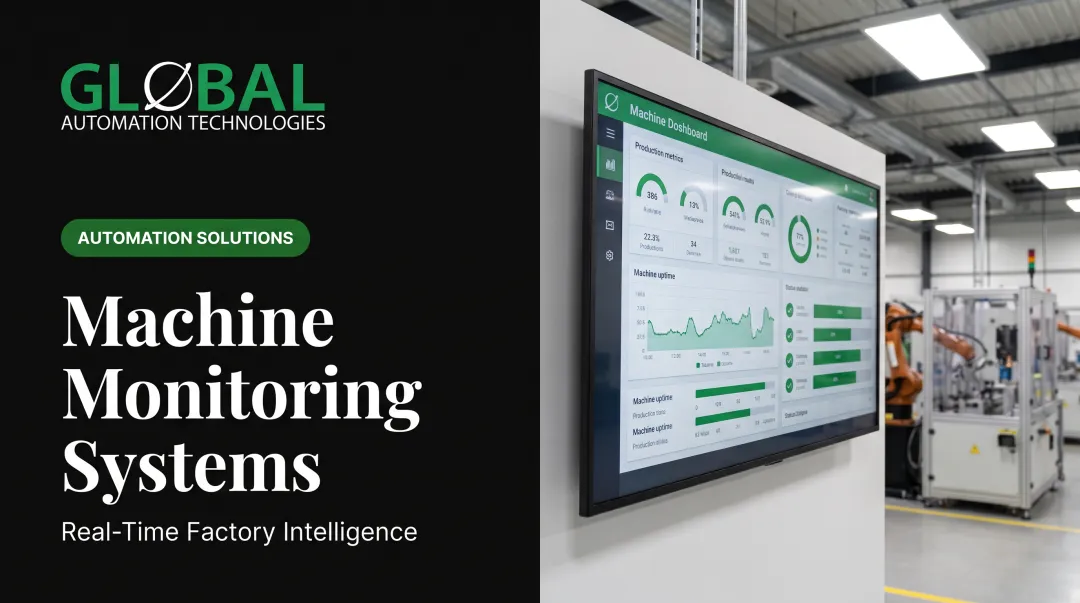
Dashboards turn live data into role-specific views operators and managers can act on:
- Operator views show live process status, cycle counts, alarm notifications, and immediate action prompts on shop-floor screens
- Supervisor views cover line-wide status, multi-cell comparisons, and shift performance summaries
- Management dashboards surface facility-wide OEE, downtime reasons, quality trends, and production throughput
ISA-101 Level 1 displays cover the operator's whole realm; Level 2 a unit or major task; Level 3 task detail; and Level 4 diagnostics. Overview displays provide concise process status and KPIs at a glance.
Historical Data Storage
Real-time data flows continuously. Time-series databases store high-frequency data efficiently for trend analysis, compliance documentation, and continuous improvement.
Technology roles:
- Edge gateways collect, normalize, and route data from PLCs, HMIs, drives, and sensors
- Historians retain time-series data for long-term analysis, emphasizing timestamp accuracy, large tag sets, high-capacity storage, and compression
Retention policies balance storage costs with audit requirements. Aerospace, medical device, and automotive sectors often require timestamped process records proving every part was made within specification.

Benefits of Real-Time Process Monitoring in Manufacturing
Immediate Problem Detection and Response
Instant deviation alerts catch defects after one bad part instead of an entire batch. This reduces scrap costs and prevents defective material from moving downstream.
A peer-reviewed metal-additive manufacturing study completed fault analysis within a layer cycle and detected 10%–20% parameter shifts, localizing defects to sub-millimeter accuracy. The system resolved problems in real time, preventing entire build failures.
Real-world impact: A robotic painting cell detects film-build deviation within seconds. The system alerts the operator, who corrects spray parameters before overspray waste and rework accumulate. Without real-time monitoring, the problem might not surface until end-of-shift inspection, costing hours of production and gallons of wasted paint.
Reduced Downtime Through Faster Root Cause Analysis
Real-time data capture preserves the exact conditions leading to a fault. Timestamped event correlation links machine faults to process parameter changes, material batch switches, or operator actions. This eliminates guesswork in troubleshooting.
A NIST historian/sensor approach consolidates historical and current process data. It produces monitoring alerts for conditions like temperature at or above 29°C (84°F), at least three failed inspections, or a machining station out of sync with workcell state.
Periodic systems lose critical context by the time an engineer investigates. Real-time systems capture the fault signature as it happens, shortening diagnostic cycles from hours to minutes.
Consistent Quality and Process Control
Continuous monitoring enforces standard operating procedures by making deviations immediately visible. Operators can't ignore a flashing alarm or rising trend line.
GLOBAL's real-time bead quality validation: Vision inspection and flow monitoring verify bead width, placement, and continuity in robotic dispensing applications. The system catches material defects, missed paths, thin beads, or gaps before parts move downstream. Engineers tune material flow rate, gun parameters, and robot speed together to deliver the correct volume at the correct location during every cycle.
Impact on first-pass yield: Real-time feedback enables in-process corrections rather than end-of-line rejection. Instead of scrapping a finished assembly, operators adjust the process while the part is still in the cell.
Enhanced Operator Accountability and Engagement
Live performance visibility creates immediate feedback loops that reinforce good practices. When operators see real-time cycle counts, uptime percentages, and quality metrics, they understand how their actions affect production.
Cultural shift: Operators become process problem-solvers. Instead of waiting for alarms, they watch trends and intervene early.
Case example: AVPE Systems installed machine monitoring for real-time machine-state feedback. Downtime data exposed insufficient staffing and skill gaps; recruitment and training brought productivity to management's target.
Barrier to avoid: Data overload and weak frontline training can undermine adoption. Data must be understandable and integrated into daily workflows, not dumped on operators without context.
Data-Driven Continuous Improvement
High-resolution process data enables root cause analysis and design of experiments (DOE) with statistical validity. Instead of guessing what caused a quality issue, engineers analyze timestamped correlations between process variables and defect occurrences.
OEE improvement: Real-time monitoring separates planned stops from unplanned downtime, identifies chronic short-stop patterns invisible in daily summaries, and breaks down losses during the day. Live availability, performance, and quality measures shorten Plan-Do-Check-Act cycles.
GLOBAL's customer base: Automotive OEMs and Tier 1 suppliers use real-time data to optimize cycle times and maximize throughput in high-volume production. Machine vision tracks moving parts so robots can perform assembly, dispensing, and inspection without stopping the line. Intelligent scheduling, buffer stations, and part tracking keep multiple spindles operating as close to 100% as possible.

Regulatory Compliance and Traceability
Aerospace, medical device, and automotive sectors require timestamped process records proving every part was made within specification. Real-time systems automatically generate audit trails without manual data entry or post-production documentation.
Regulatory context:
- Aerospace: IAQG identifies 9100:2016 as the aviation, space, and defense QMS standard
- Medical devices: 21 CFR 820 specifies dated complaint and service records, UDI for each device or batch, and documented labeling/packaging inspection results
- Automotive: IATF 16949 GM customer-specific requirements include methods for employees to call for help when needed
Robotic assembly systems record torque values, test results, serial numbers, and process parameters as production occurs, providing complete traceability without manual logbooks.
Implementation Considerations
Before deploying real-time monitoring, assess your starting point:
- Catalog existing equipment: Identify which machines have native connectivity and which need retrofit sensors or gateway devices
- Determine connectivity options: Evaluate protocols (PROFINET, OPC UA, MQTT, EtherNet/IP) and network infrastructure
- Establish baseline performance metrics: Measure current scrap rates, downtime frequency, first-pass yield, and cycle times so you can quantify improvement
Phased rollout strategy:
- Start with highest-value or highest-problem processes where monitoring will surface the fastest wins
- Prove ROI with measurable scrap reduction or faster downtime response before expanding scope
- Expand to additional cells and lines once operators and IT can support the load
Attempting full-facility deployment simultaneously risks overwhelming operators, overloading IT infrastructure, and diluting focus. Pilot projects build expertise and demonstrate value before scaling.
Change management:
Train operators and supervisors to interpret real-time data and act on it. Move teams from waiting for alarms to watching trends and intervening early.
Keep alerts useful rather than noisy:
- Assign clear thresholds and owners so data stays actionable
- Fit notifications into daily workflows
- Limit low-priority signals that cause overload
Brownfield modernization:
GLOBAL, a Level 5 FANUC Authorized System Integrator, addresses legacy equipment through turnkey retrofit projects and embedded engineering support. Controls engineers integrate SCADA and IoT connectivity, machine vision, and health assessments into existing lines. Detailed procedures (legacy protocols, hardware compatibility, sensor retrofit methods) still vary by equipment and application.
Real-Time Monitoring vs. Periodic Reporting
| Aspect | Real-Time Monitoring | Periodic Reporting |
|---|---|---|
| Timing | Second-by-second visibility | Hourly, daily, or weekly summaries |
| Purpose | Immediate intervention during production | Trend analysis and management review |
| Data granularity | High-frequency process variables | Aggregated totals and averages |
| Response | Stop the line, adjust parameters, alert operator | Schedule maintenance, plan improvements |
| Use case | Prevent defects from multiplying | Identify patterns over weeks or months |
Real-time monitoring enables action while production is ongoing. Per ISA guidance on process quality, continuous sensors expose changing process values for immediate correction, while delayed sample results are better suited to retrospective optimization.
Strong operations use both: real-time monitoring to catch problems on the line now, and periodic reports to surface long-term trends and plan improvements.
Frequently Asked Questions
What does real-time process monitoring mean?
Real-time process monitoring is continuous, automated data capture and analysis with response times under five seconds. The system acquires sensor data, runs analytics, triggers alerts, and enables intervention while production is still running, not hours later.
What are the main types of real-time process monitoring?
NIST identifies network-based, agent-based, and historian/sensor-based approaches. Common plant categories include machine state (runtime, idle, fault), process parameters (temperature, pressure, force), quality (vision, measurement), and predictive health (vibration, wear).
What are examples of real-time data for process monitoring?
Examples include robot cycle time, weld current and voltage, paint film thickness, spindle load, vibration, and part temperature during curing. In dispensing, systems often track flow rate, dispense volume, bead size, placement accuracy, and valve timing.
What industries benefit most from real-time process monitoring?
Automotive, aerospace and defense, heavy equipment, and other high-volume or high-precision plants benefit most. Automotive downtime can exceed $2 million per hour, so early detection is financially critical—areas where GLOBAL supports OEM work across body shop, paint, powertrain, and final assembly.
How does real-time monitoring integrate with existing MES or ERP systems?
ISA-95 defines the Level 3 manufacturing-to-Level 4 business interface. Real-time systems typically send summarized data (cycle counts, quality events, downtime reasons) to MES and ERP, while historians keep detailed timestamped process data for deeper analysis.
What is the typical ROI timeline for implementing real-time process monitoring?
Expect measurable gains in scrap reduction and downtime response within 3–6 months. Full ROI typically lands in 12–18 months, depending on production volume, visibility gaps, and how costly current problems are.